Digital Ecosystems: Creative Coding & Data Visualization
Bridging Technical Logic and Visual Narrative
This body of work focuses on the intersection of brand strategy and creative technology — transforming complex datasets and scientific concepts into interactive, high-performance digital experiences.
AGENCY: Novamondo
FIELDS: UI/UX-Design, Creative Coding
Circular Applied Research Lab
Interactive Identity Accompanying the evolution of the Circular Applied Research Lab from its conceptual foundations to its digital launch, this project involved a holistic approach to User Experience (UX) and Interface Design (UI). In close collaboration with the technical development team, the platform was brought to life using a stack of p5.js and Nuxt.js.
The centerpiece is an interactive generative graphic that allows users to “play” with the brand’s core principles — a digital manifestation of the lab’s mission to transcend the boundaries between science and sustainable business.
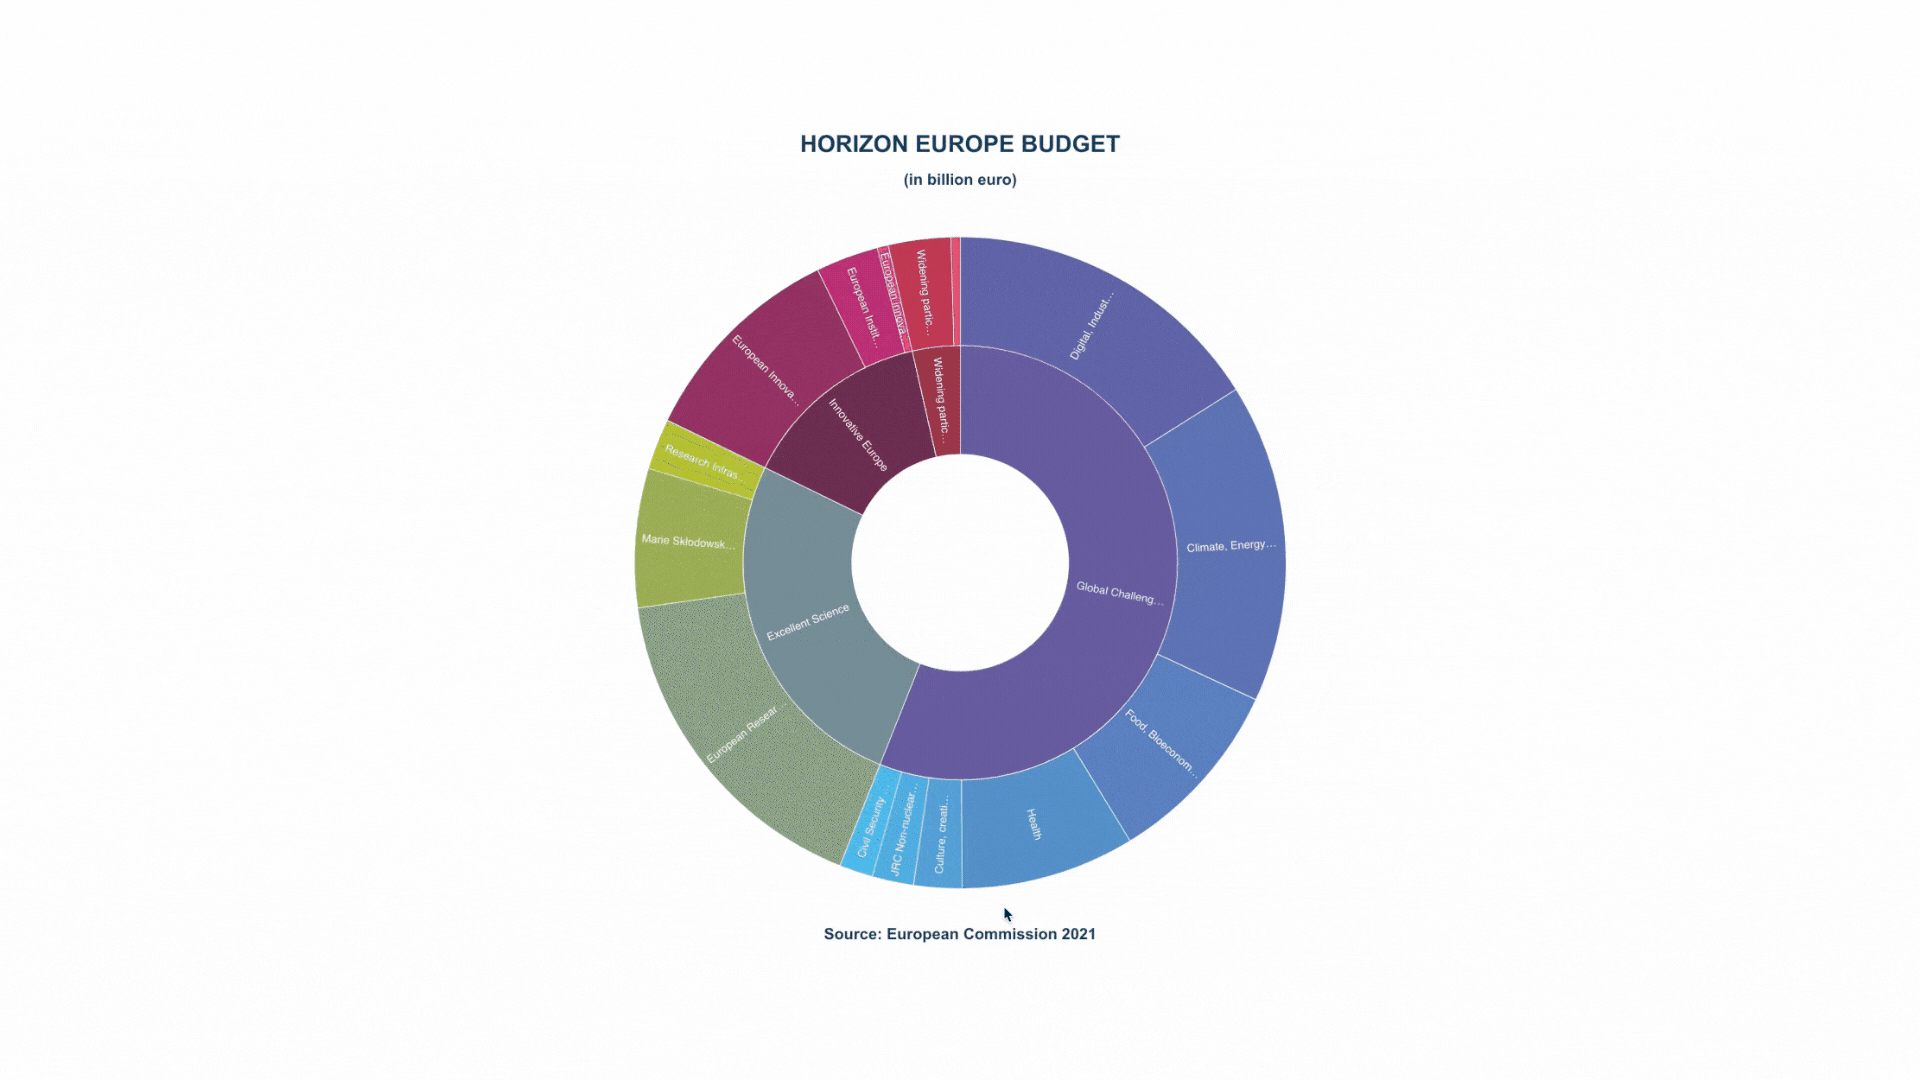
ERA Portal Austria
Data-Driven Visualization
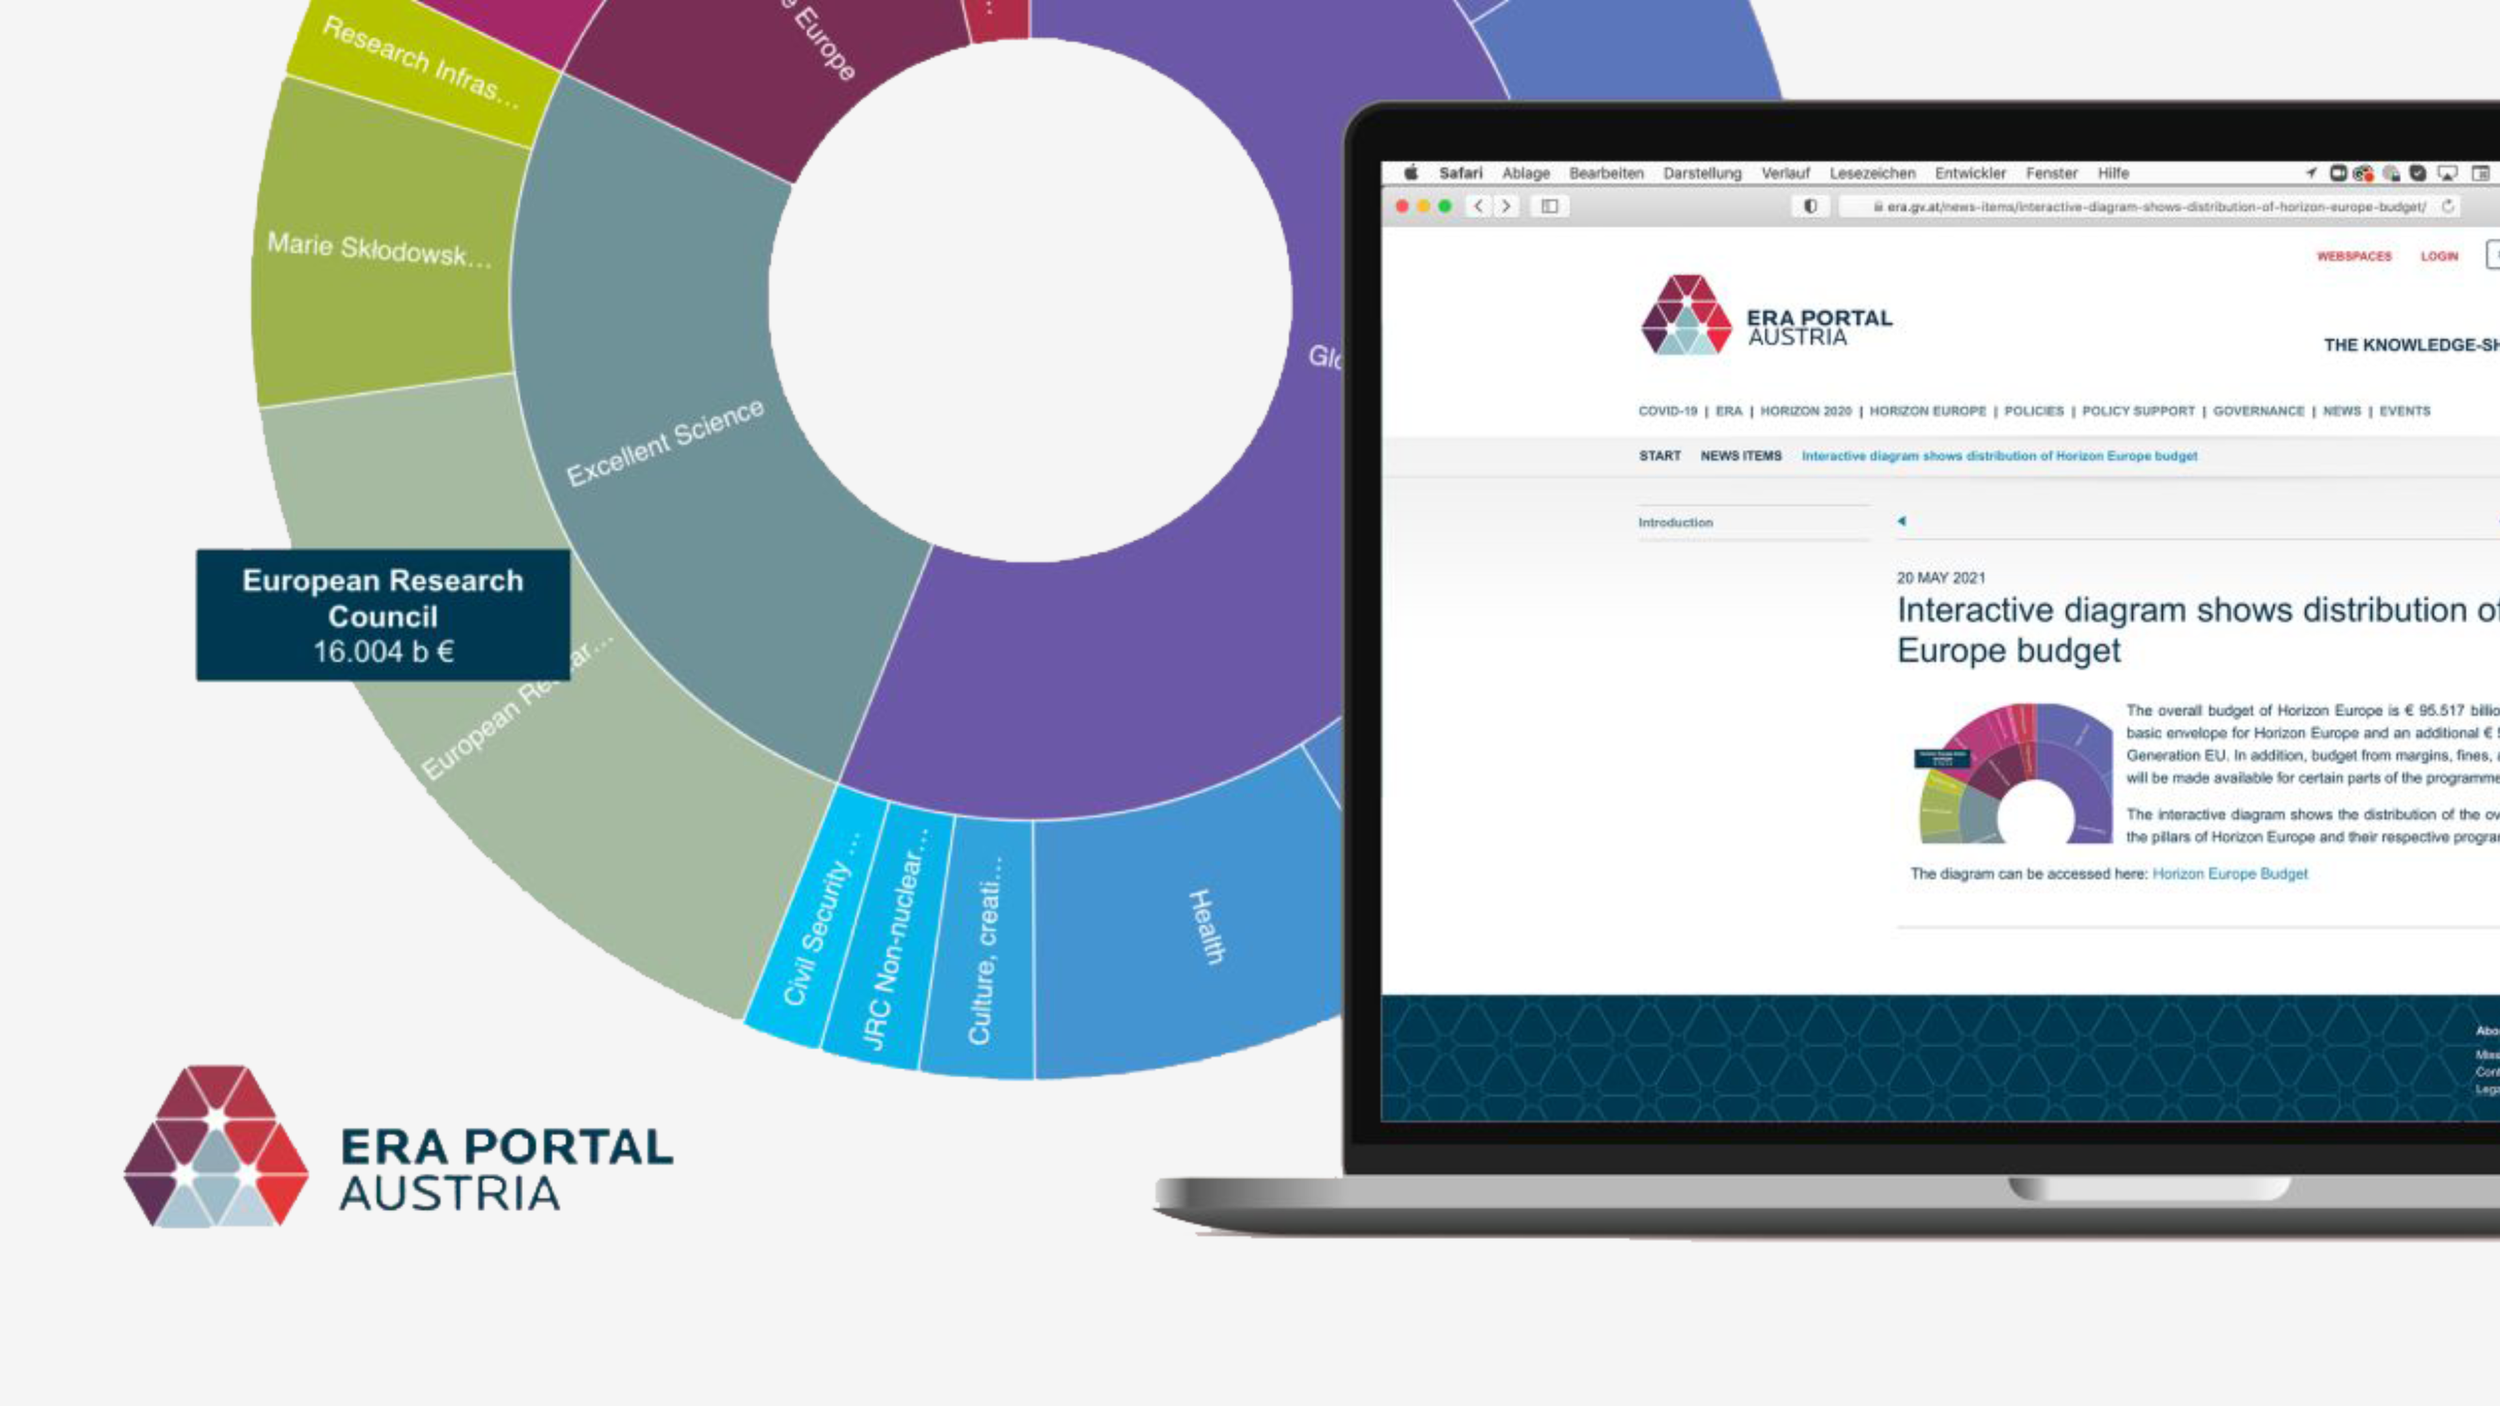
In partnership with SYNTOP, this project focused on the visual translation of complex budgetary data for the ERA Portal Austria (Horizon Europe). Utilizing D3.js (Data-Driven Documents), the team developed a powerful visualization system that turns abstract funding metrics into a clear, interactive narrative.
The project represents a sophisticated balance of data integrity and intuitive design, ensuring that critical information remains accessible and engaging for a global audience of importers, partners, and stakeholders.